Quick Start Guide
Observability
GoFr, by default, manages observability in different ways once the server starts:
Logs
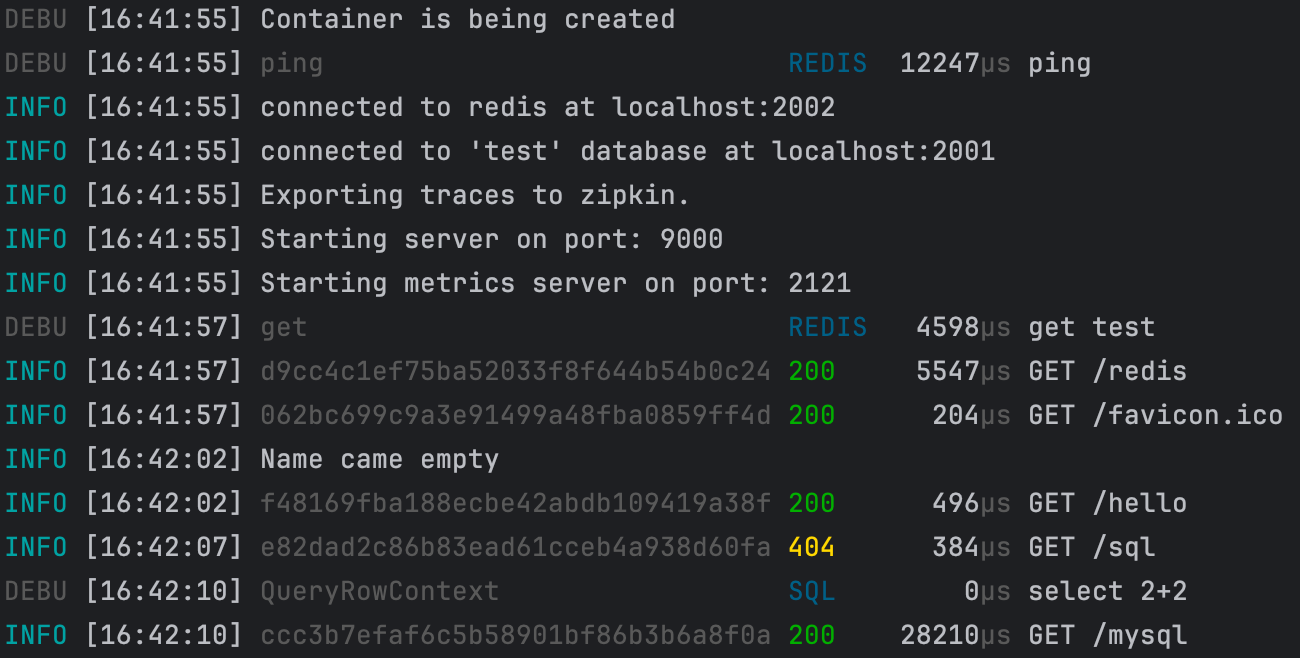
Logs offer real-time information, providing valuable insights and immediate visibility into the ongoing state and activities of the system. It helps in identifying errors, debugging and troubleshooting, monitor performance, analyzing application usage, communications etc.
GoFr logger allows customizing the log level, which provides flexibility to adjust logs based on specific needs.
Logs are generated only for events equal to or above the specified log level; by default, GoFr logs at INFO level. Log Level can be changed by setting the environment variable LOG_LEVEL value to DEBUG, INFO, NOTICE, WARN, ERROR or FATAL.
When the GoFr server runs, it prints a log for reading configs, database connection, requests, database queries, missing configs, etc. They contain information such as request's correlation ID, status codes, request time, etc.
Log Levels
DEBUG
This is the lowest priority level. It represents the most detailed/granular information.
Note: DEBUG logs should be enabled only in development or controlled troubleshooting scenarios.They are typically disabled in production environments due to performance overhead and security risks.
Example
ctx.Debug("Calc trace - Price:", 150, "Discount:", 0.2, "Tax Multiplier:", 1.05)
INFO
INFO Represents normal operational events during application execution and acts as the default logging level, ensuring baseline observability without excessive verbosity.
Example
ctx.Info("Application configuration loaded", "Source", "env")
NOTICE
A level higher than INFO but lower than WARN. It shares the same visual prominence as a Warning but implies a "normal" condition rather than a problem. In simple words, it's used for events that are normal but rare and significant.
Example
ctx.Notice("Configuration hot-reload triggered by system admin")
WARN
WARN should represent abnormal runtime conditions that indicate instability or degraded operation (retries, fallbacks, transient failures), not long-term code hygiene issues like deprecated API usage. If something would show up repeatedly in a healthy system, it shouldn’t be a WARN, otherwise the signal gets diluted and operators start ignoring it.
Example
ctx.Warn("Database connection timeout. Retrying...", "attempt", 1, "retry_after", "2s")
ERROR
Indicates a failure event. This level routes logs to stderr (Standard Error), ensuring visibility to error tracking tools.
Example
ctx.Error("DB Query Timeout: Analytics fetch failed.", "error", errors.New("query execution exceeded 3000ms"))
FATAL
The highest priority level. FATAL represents a critical system failures where the application cannot function.
Note: FATAL terminates the process immediately and is intended only for startup-time failures, not runtime request handling.
Example
app.Logger().Fatal("Startup Failure: Mandatory SSL certificate missing.", "path", "/etc/certs/server.crt")
Note: Performance & Log Volume.
- Early Exit Optimization: The logger implements an "Early Exit" strategy. If the incoming log level is lower than the configured
LOG_LEVEL, the function returns immediately before performing any formatting or allocation.- Locking Overhead: The terminal output utilizes a mutex lock to ensure thread safety.
Logs are well-structured, they are of type JSON when exported to a file, such that they can be pushed to logging systems such as Loki, Elasticsearch, etc.
Metrics
Metrics enable performance monitoring by providing insights into response times, latency, throughput, resource utilization, tracking CPU, memory, and disk I/O consumption across services, facilitating capacity planning and scalability efforts.
Metrics play a pivotal role in fault detection and troubleshooting, offering visibility into system behavior.
They are instrumental in measuring and meeting service-level agreements (SLAs) to ensure expected performance and reliability.
GoFr publishes metrics to port: 2121 on /metrics endpoint in Prometheus format.
Default Metrics
| Name | Type | Description |
|---|---|---|
| app_go_numGC | gauge | Number of completed Garbage Collector cycles |
| app_go_routines | gauge | Number of Go routines running |
| app_go_sys | gauge | Number of total bytes of memory |
| app_sys_memory_alloc | gauge | Number of bytes allocated for heap objects |
| app_sys_total_alloc | gauge | Number of cumulative bytes allocated for heap objects |
| app_info | gauge | Number of instances running with info of app and framework |
| app_http_response | histogram | Response time of HTTP requests in seconds |
| app_http_service_response | histogram | Response time of HTTP service requests in seconds |
| app_sql_open_connections | gauge | Number of open SQL connections |
| app_sql_inUse_connections | gauge | Number of inUse SQL connections |
| app_sql_stats | histogram | Response time of SQL queries in milliseconds |
| app_redis_stats | histogram | Response time of Redis commands in microseconds |
| app_pubsub_publish_total_count | counter | Number of total publish operations |
| app_pubsub_publish_success_count | counter | Number of successful publish operations |
| app_pubsub_subscribe_total_count | counter | Number of total subscribe operations |
| app_pubsub_subscribe_success_count | counter | Number of successful subscribe operations |
| app_http_retry_count | counter | Total number of retry events |
| app_http_circuit_breaker_state | gauge | Current state of the circuit breaker (0 for Closed, 1 for Open). Used for historical timeline visualization. |
| app_graphql_operations_total | counter | Total number of GraphQL operations received. Labels: operation_name, type. |
| app_graphql_error_total | counter | Total number of GraphQL operations that returned an error. Labels: operation_name, type. |
| app_graphql_request_duration | histogram | Response time of GraphQL requests in seconds. Labels: operation_name, type, status. |
| app_cron_job_total | counter | Total number of cron job executions. Label: job. |
| app_cron_job_success | counter | Number of successful cron job executions. Label: job. |
| app_cron_job_failures | counter | Number of failed cron job executions. Label: job. |
| app_cron_job_duration | histogram | Duration of cron job execution in seconds. Label: job. |
For example: When running the application locally, we can access the /metrics endpoint on port 2121 from: http://localhost:2121/metrics
GoFr also supports creating custom metrics.
Disabling the Metrics Server
To disable the metrics server entirely, set the METRICS_PORT environment variable to 0:
METRICS_PORT=0
Example Dashboard
These metrics can be easily consumed by monitoring systems like Prometheus and visualized in dashboards using tools like Grafana.
You can find the dashboard source in the GoFr repository.
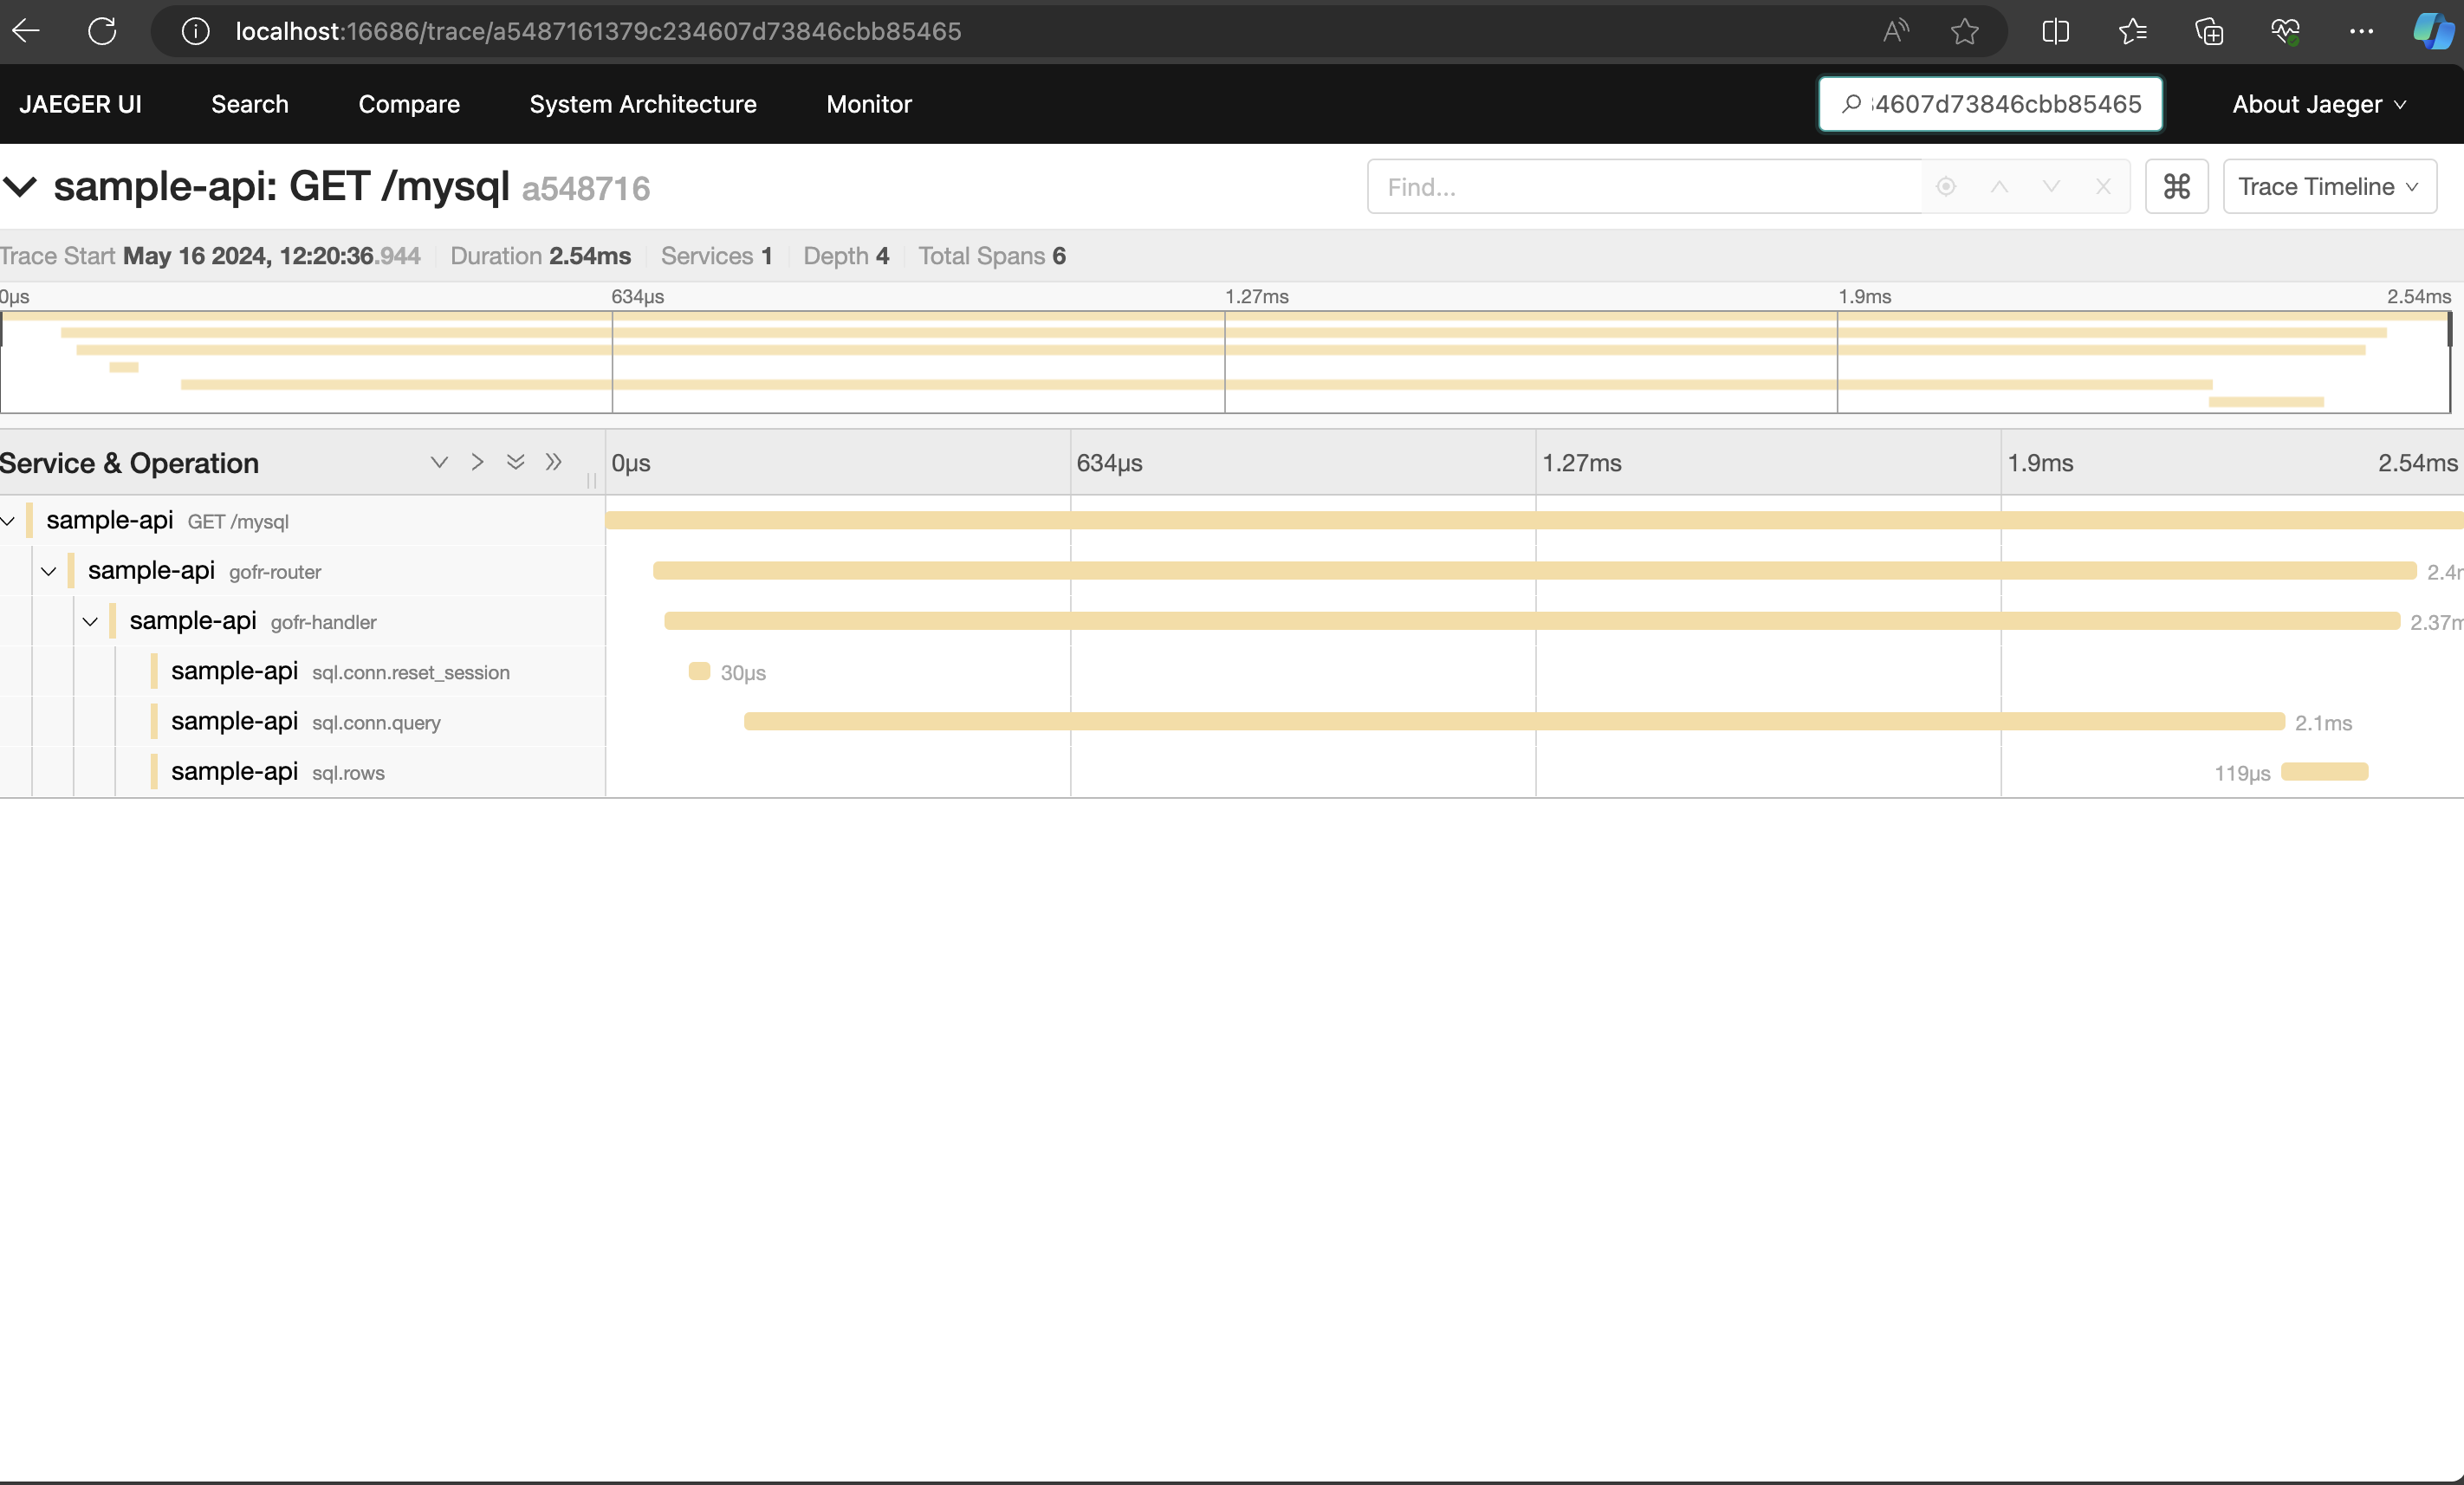
Tracing
Tracing is a powerful tool for gaining insights into your application's behavior, identifying bottlenecks, and improving system performance. A trace is a tree of spans. It is a collective of observable signals showing the path of work through a system. A trace on its own is distinguishable by a TraceID.
In complex distributed systems, understanding how requests flow through the system is crucial for troubleshooting performance issues and identifying bottlenecks. Traditional logging approaches often fall short, providing limited visibility into the intricate interactions between components.
Automated Tracing in GoFr
GoFr automatically exports traces for all requests and responses. GoFr uses OpenTelemetry , a popular tracing framework, to automatically add traces to all requests and responses.
Automatic Correlation ID Propagation:
When a request enters your GoFr application, GoFr automatically generates a correlation-ID X-Correlation-ID and adds it to the response headers. This correlation ID is then propagated to all downstream requests. This means that user can track a request as it travels through your distributed system by simply looking at the correlation ID in the request headers.
Pub/Sub Tracing:
Tracing automatically extends across pub/sub boundaries. Every Publish injects the active trace context into the outgoing message (Kafka headers, NATS headers, Google Pub/Sub / SQS attributes, etc.) and every Subscribe extracts it to start the consumer span as a child of the producer — so an HTTP → publish → subscribe → publish → subscribe flow shows up as one connected trace. See Publisher Subscriber → Distributed Tracing for details.
Configuration & Usage:
GoFr has support for following trace-exporters. Pick one — don't run all of them at once.
1. OpenTelemetry Protocol (recommended):
OTLP over gRPC is the current OpenTelemetry standard and works with any OTLP-compatible backend (Jaeger 1.35+, Tempo, Honeycomb, the OpenTelemetry Collector, etc.).
Add OTLP configs in .env file, your .env will be updated to:
APP_NAME=test-service
HTTP_PORT=8000

REDIS_HOST=localhost
REDIS_PORT=2002
REDIS_PASSWORD=password

DB_HOST=localhost
DB_USER=root
DB_PASSWORD=root123
DB_NAME=test_db
DB_PORT=3306

# tracing configs
TRACE_EXPORTER=otlp
TRACER_URL=localhost:4317
TRACER_RATIO=1.0

LOG_LEVEL=DEBUG
[!NOTE]
TRACER_RATIO=1.0samples 100% of traces — convenient for local development so a singlecurlproduces a visible trace. In production lower this (e.g.0.05for 5%) to keep export volume manageable.
2. Jaeger:
To see the traces, install Jaeger image using the following Docker command:
docker run -d --name jaeger \
	-e COLLECTOR_OTLP_ENABLED=true \
	-p 16686:16686 \
	-p 14317:4317 \
	-p 14318:4318 \
	jaegertracing/all-in-one:1.41
Add Jaeger Tracer configs in .env file, your .env will be updated to:
# ... no change in other env variables

# tracing configs
TRACE_EXPORTER=jaeger
TRACER_URL=localhost:14317
TRACER_RATIO=1.0
Open jaeger and search by TraceID (correlationID) to see the trace.
3. Zipkin (legacy):
[!NOTE]
TRACE_EXPORTER=zipkinis deprecated and will be removed in a future release. Zipkin v2.24+ supports OTLP natively — prefer the OTLP exporter above. The Zipkin exporter remains for users on older Zipkin servers.
To see the traces install zipkin image using the following Docker command:
docker run --name gofr-zipkin -p 2005:9411 -d openzipkin/zipkin:latest
Add Tracer configs in .env file:
# ... no change in other env variables

# tracing configs
TRACE_EXPORTER=zipkin
TRACER_URL=http://localhost:2005/api/v2/spans
TRACER_RATIO=1.0
Open zipkin and search by TraceID (correlationID) to see the trace.
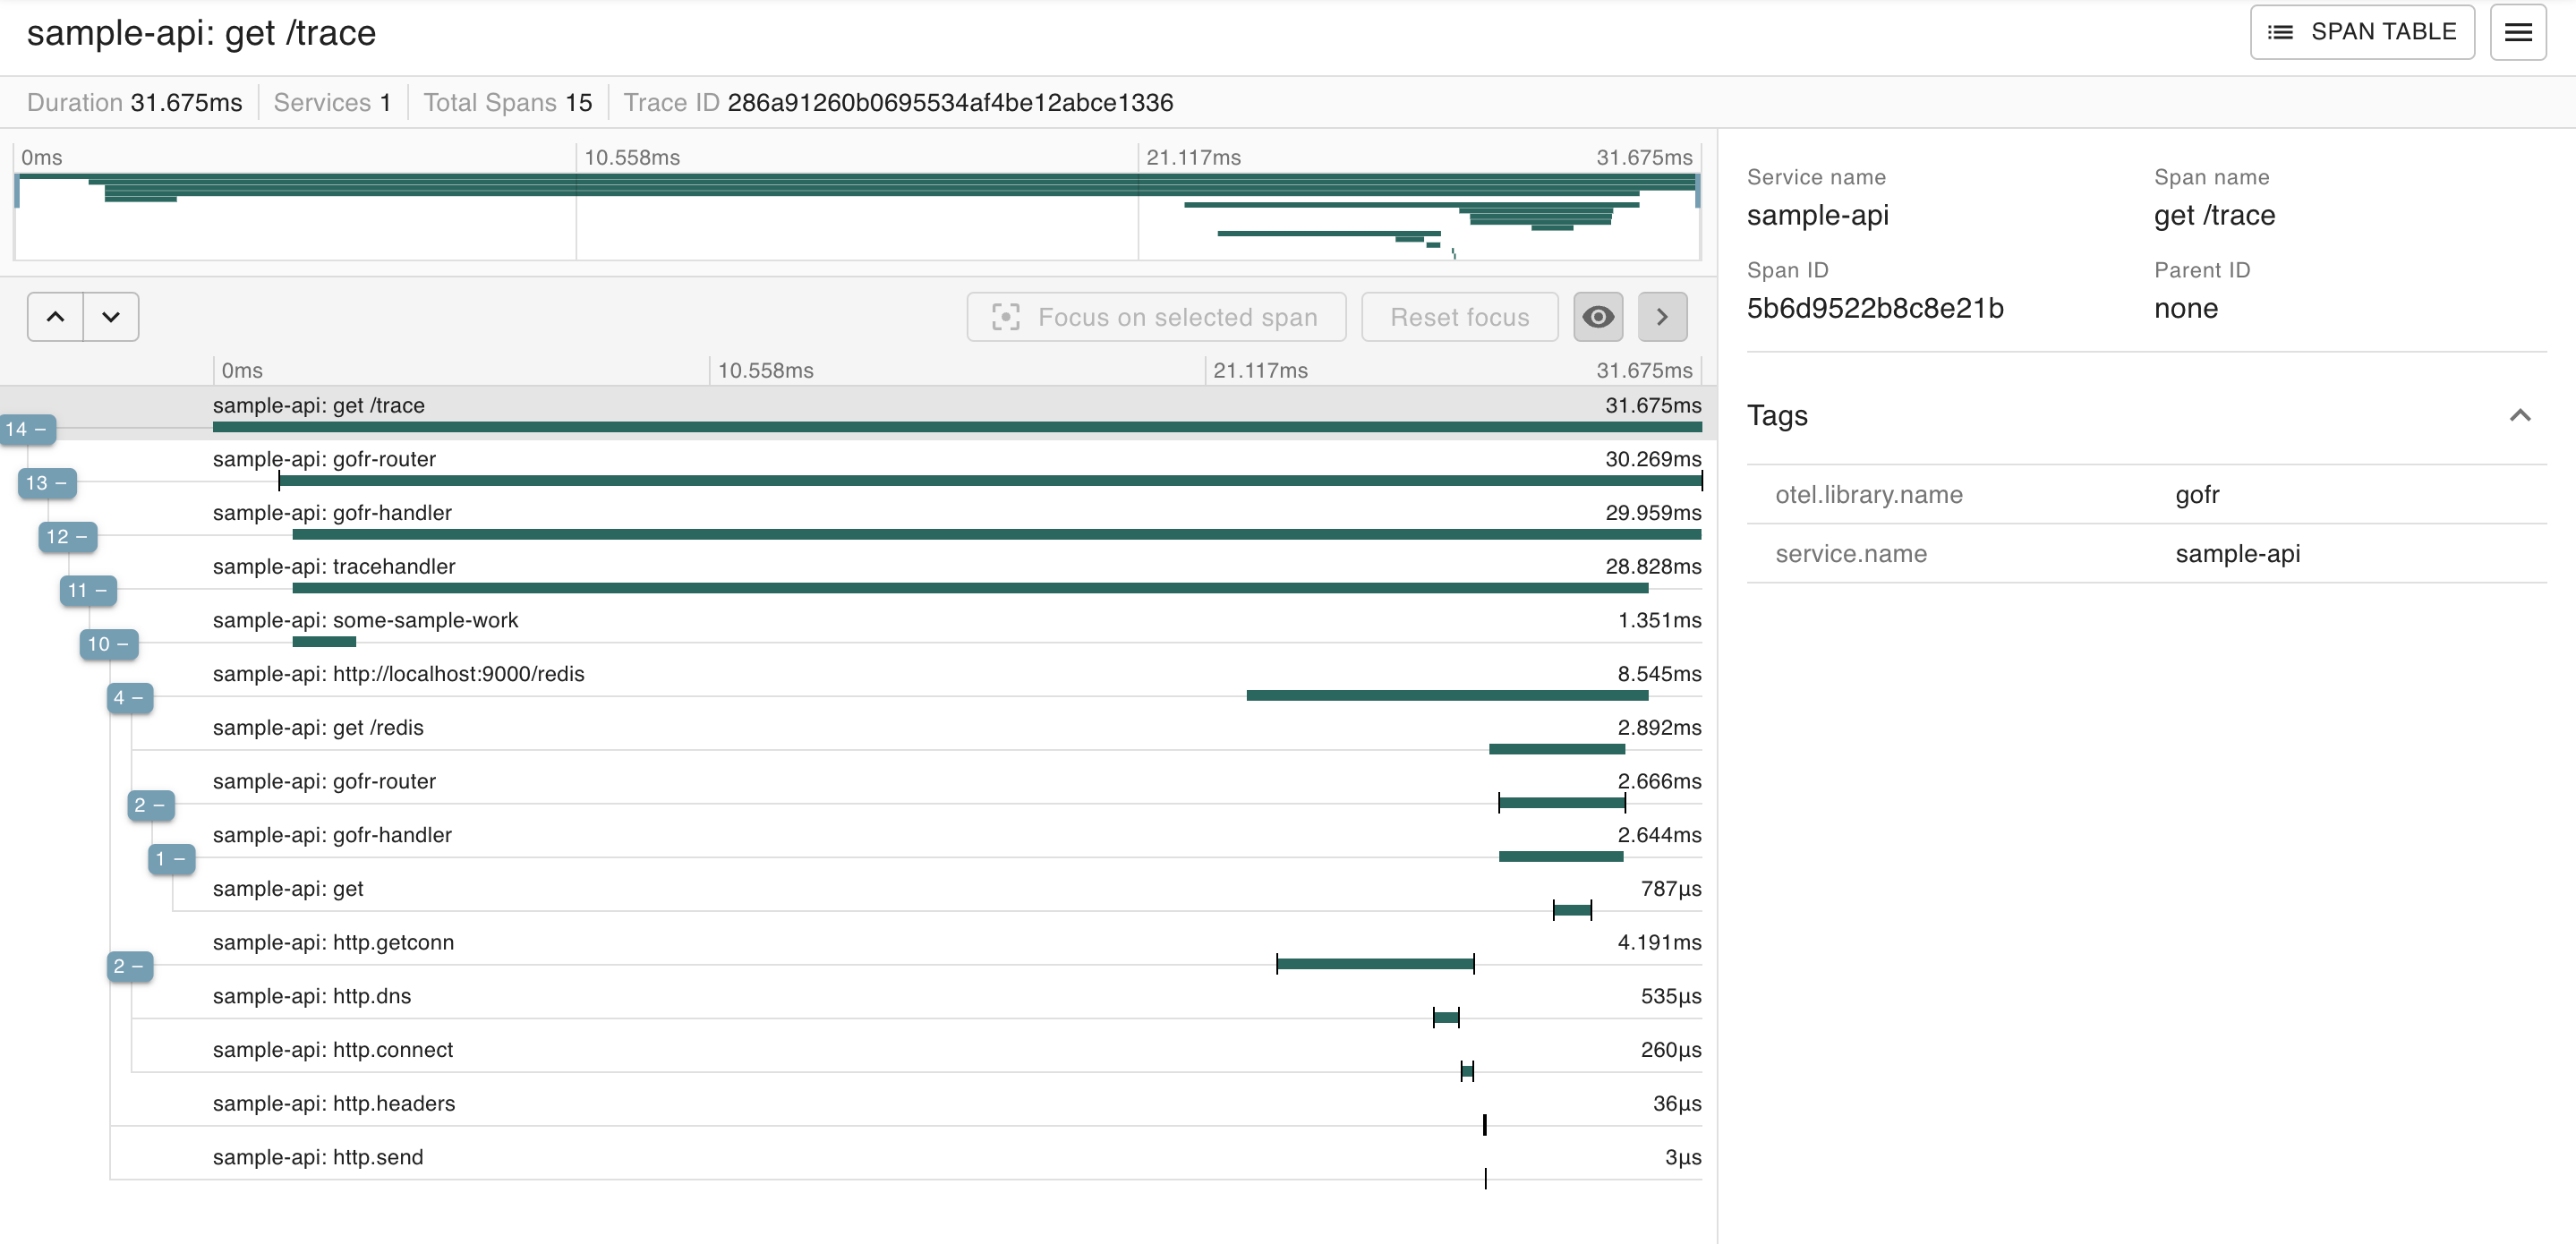
4. GoFr Tracer:
GoFr tracer is GoFr's own custom trace exporter as well as collector. Users can search a trace by its TraceID (correlationID) in GoFr's own tracer service, available anywhere, anytime.
Add GoFr Tracer configs in .env file, your .env will be updated to
# ... no change in other env variables

# tracing configs
TRACE_EXPORTER=gofr
TRACER_RATIO=0.1
[!NOTE]
TRACER_RATIOrefers to the proportion of traces that are exported through sampling. It ranges between 0 and 1. By default, this ratio is set to 1, meaning all traces are exported.Open gofr-tracer and search by TraceID (correlationID) to see the trace.
Custom Authentication Headers
Many observability platforms require custom headers for authentication. GoFr supports this through the TRACER_HEADERS configuration, which accepts comma-separated key=value pairs following the OpenTelemetry standard format.
Usage Examples
Single Header:
# Honeycomb
TRACER_HEADERS="X-Honeycomb-Team=your_api_key"
Multiple Headers:
# Grafana Cloud with multiple headers
TRACER_HEADERS="Authorization=Basic base64encodedcreds,X-Scope-OrgID=tenant-1"
# API key with special characters
TRACER_HEADERS="X-Api-Key=secret123,Authorization=Bearer token"
Configuration Example
Here's an example for sending traces to Grafana Cloud with authentication:
APP_NAME=my-service

# Grafana Cloud OTLP endpoint with authentication
TRACE_EXPORTER=otlp
TRACER_URL=otlp-gateway-prod-us-east-0.grafana.net:443
TRACER_HEADERS="Authorization=Basic dXNlcm5hbWU6cGFzc3dvcmQ=,X-Scope-OrgID=123456"
TRACER_RATIO=1.0